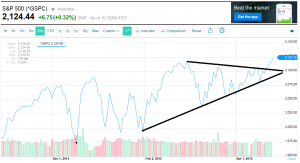
As seen on the chart below, the S&P500 has broken out of a narrowing triangle pattern to the upside. It also broke above the March 2nd high. From a technical standpoint, this could provide some near term momentum
Though we do not rely purely on technical analysis, it is interesting to watch breakout patterns like the chart indicates. We believe the underlying market fundamentals remain sound as well and remain bullish intermediate to longer term. Click chart to enlarge.
The content contained herein is for informational purposes only and does not constitute a solicitation or offer to sell securities or investment advisory services. Investments are not FDIC-insured, nor are they deposits of or guaranteed by a bank or any other entity, so they may lose value. Past performance is not a guarantee of future results and clients should not assume that future performance will be comparable to past performance.
Our Form ADV Part 2A firm disclosure document is available for review. View Form ADV Part 2A, call or email to request a copy. This document contains detailed information about Royal Fund Management, LLC and the services provided.
Full Disclosure